
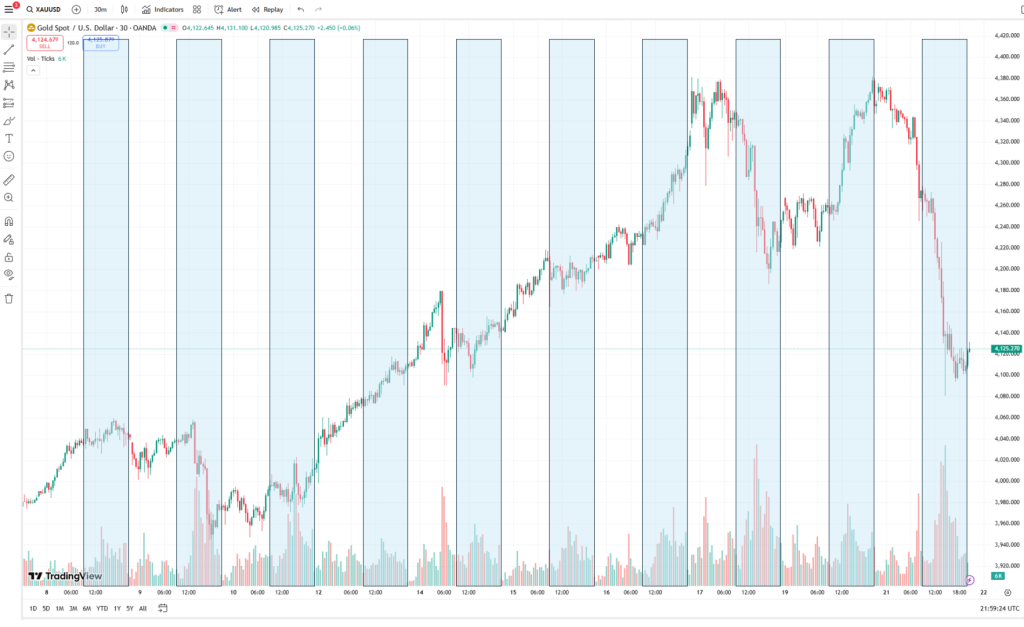
Gold isn’t supposed to behave like this. On October 21, 2025, during New York trading hours, the world’s oldest monetary metal did something extraordinary: it fell from $4,378 to $4,093 per ounce in less than eight hours: a collapse of almost 6½ percent. No war had broken out, no inflation surprise had hit the wires, and no central bank had announced a policy shock. Yet billions of dollars’ worth of “gold” vanished from screens before Asian markets even opened, as if gold is now a meme stock. Kitco News reported that the sudden sell-off was driven by heavy futures liquidation and thin liquidity during U.S. trading hours.
For a metal that spent centuries symbolizing stability, the day’s trading looked more like a meme-stock implosion than a safe-haven correction. On social media, traders called it a “gold rug-pull.” In institutional chat rooms, it was simply another reminder that the modern gold market behaves less like a vault and more like a casino.
This was not a freak anomaly. Over the past several weeks, gold has posted violent, almost rhythmic intraday swings. Surging during Asian hours when physical buyers are active, then collapsing during U.S. hours when futures and derivatives dominate. The pattern hints at something deeper than speculative noise: it reveals the widening gap between “paper gold”, the financial contracts that set the global price, and “monetary gold,” the real metal being accumulated by central banks and long-term holders. Investors exploring how gold can act as a hedge in this environment may want to review our Gold Hedging Thesis.
Two Very Different Gold Markets
When investors talk about “gold,” they are often describing two completely different things. One is the financial market, where banks, hedge funds, and algorithms trade futures, options, and exchange-traded funds. These are paper claims whose value tracks the price of gold but seldom require delivery of metal. The other is the physical market, where bars, coins, and ingots actually change hands between refiners, mints, jewelers, and central-bank vaults. Both use the same price reference, the so-called “spot price”. The financial market moves fast. Billions of dollars of synthetic gold are created and destroyed every day. The physical market moves slowly. Shipments are booked months in advance, vault audits take weeks, and central banks buy methodically, not impulsively.
The confusion arises because the quoted price of gold, the number flashing on Bloomberg terminals or phone apps, is determined by the financial side, even though the long-term demand is driven by the physical side. This is why gold can plunge hundreds of dollars in a trading session even when physical demand in Asia is strong and central banks are adding to reserves. The two markets share a number, but they obey different laws of motion.
The Evolution of Paper Gold
The modern gold market was born out of convenience. When the United States closed the gold window in 1971 and ended the fixed $35 peg, gold was suddenly free to trade like any other commodity. But shipping heavy bars across oceans for each trade was slow, expensive, and risky. Traders needed a way to buy and sell gold without actually moving it. That innovation came in 1974, when New York’s COMEX exchange launched gold futures contracts. Each contract represented 100 troy ounces of gold stored in a registered warehouse. In practice, almost no one took delivery. Traders simply bought or sold contracts to express a view on the price. The futures market offered leverage, liquidity, and the ability to hedge risk. It quickly became the global reference for gold pricing.
In London, where physical bullion had been traded for centuries, banks began offering “unallocated” gold accounts. These accounts allowed clients to hold a claim on gold without specifying particular bars. The banks pooled client holdings, effectively creating a fractional-reserve system for gold. It worked smoothly because few clients ever demanded physical delivery , and just as few depositors demand all their cash at once.
By the 1980s, these two innovations, futures in New York and unallocated accounts in London, had turned gold into a fully financialized asset. The system made trading easy, but it also introduced a disconnect: the market price of gold was now determined largely by paper contracts, not by the buying and selling of physical metal.
How the Spot Price Is Really Made
When investors quote the “spot gold price,” they imagine a global marketplace where bars are continuously traded for cash. In reality, there is no single exchange for gold. Instead, what we call the “spot price” is a synthetic benchmark derived from a network of overlapping markets, each with its own rules, participants, and settlement systems.
In London, the over-the-counter (OTC) market is where most “spot” trades occur. But these are usually unallocated: essentially promises to deliver gold rather than physical transfers of bars. Banks quote prices to one another in U.S. dollars per troy ounce, settle transactions electronically, and only occasionally move real metal between vaults. London’s OTC market clears tens of billions of dollars’ worth of gold daily, but physical movement is minimal. Meanwhile, in New York, the COMEX futures contract serves as the anchor for global price discovery. Because futures are traded nearly 24 hours a day and have deep liquidity, traders and algorithms use the front-month contract to set prices on everything from ETFs to retail coins. Arbitrage between COMEX and London keeps the two markets aligned within a narrow range.
So, the “spot price” displayed on a chart or quoted by a dealer is actually an implied price. It is a mathematical translation of futures and unallocated OTC prices into a notional immediate-delivery value. The real-world market for physical bars (refineries, central banks, jewelry manufacturers) simply references that number when setting transaction prices, adding or subtracting a small premium or discount depending on local supply and demand. The key point is this: the financial market sets the reference price, even though the physical market ultimately determines gold’s long-term equilibrium. On any given trading day, those two can move in opposite directions.
Understanding the Volume on a Gold Chart
Open a chart of spot gold on any trading platform and you’ll likely see volume bars underneath the price. Most assume this represents the number of ounces traded that hour or day. It doesn’t. Because there is no centralized physical gold exchange, charting platforms use proxies for volume. Some use data from COMEX futures (each contract = 100 ounces). Others use “tick volume,” counting how many times a quote changes on major OTC feeds. A few retail platforms simply simulate volume to mimic equity charts.
What this means is that the volume bars reflect trading activity, not physical movement. A high-volume day in New York may see half a million futures contracts change hands, representing 50 million ounces of “paper gold” (roughly 1,500 tonnes). Yet actual COMEX deliveries that day might total only two to three tonnes. This disconnect explains why gold can appear to trade with enormous liquidity while the real bullion market remains tight. Futures and derivatives allow market participants to create almost infinite synthetic supply. Banks and funds can short or long gold contracts far beyond the quantity of metal sitting in vaults. The result is a highly elastic financial market built atop a finite physical foundation.
When you see a surge in volume on your spot gold chart, it means traders are repositioning, not that trucks are lining up at vaults. Price moves on those days reflect leverage and liquidity, not real-world demand. Does it mean that gold is now a meme stock? Read on…
Physical Gold: The Slow, Silent Market Beneath the Surface
Beneath the flashing screens and electronic trades lies the physical gold market, and it moves to a very different rhythm. This is the domain of refiners, central banks, bullion dealers, jewelry fabricators, and sovereign mints. Bars are cast, assayed, and shipped in standard forms: 400-ounce “Good Delivery” bars in London, 1-kilogram bars in Shanghai, and smaller bars for retail markets in India and the Middle East. These flows are measured in tonnes per month, not contracts per second.
Physical demand is steady, seasonal, and deeply cultural. Indian festivals like Diwali, Chinese New Year, and Middle Eastern wedding seasons all influence buying patterns. Central banks buy methodically through state agencies, sometimes over years, to diversify reserves. The supply side is equally slow: gold mining adds roughly 3,000 to 3,500 tonnes per year, and recycling contributes another 1,000 tonnes depending on price. Unlike the speculative paper market, the physical market is constrained by logistics and cost. Moving gold across borders requires security, insurance, customs clearance, and often central-bank approval. Once gold enters a national vault, it tends to stay there. This makes physical gold sticky. It moves only when macro forces demand it. Crucially, most of this activity occurs outside the Western financial system. Over the past decade, the gravitational center of gold trading has shifted eastward. The Shanghai Gold Exchange (SGE) now handles the largest volume of physically settled contracts in the world, denominated in Chinese renminbi. India, the United Arab Emirates, and Singapore have become regional bullion hubs. These markets are anchored in real bars and coins, not leveraged contracts.
When physical demand rises in Asia, it often absorbs metal from Western vaults, tightening available supply in London and New York. Because the price is set by the financial markets, you won’t see that tightening reflected immediately in the spot price, at least not until arbitrage forces eventually pull the two worlds back together.
Central Banks: The Quiet Giants Behind the Bid
While traders in New York speculate on yields, central banks have been quietly buying gold, in quantities not seen since the 1960s. According to the World Gold Council, 2022 and 2023 marked the two strongest years of official-sector purchases on record, and 2024–25 has continued that pace.
Why are central banks, the ultimate long-term investors, buying a metal that Wall Street treats like a volatile hedge? The answer lies in risk management, not speculation. After the U.S. and its allies froze Russia’s foreign-exchange reserves in 2022, roughly $300 billion held in Western banks, policymakers around the world realized that financial assets held abroad can be politically confiscated. Gold, however, cannot be frozen if it sits in your own vault. It carries no counterparty risk, requires no SWIFT payment channel, and holds universal value.
For countries like China, India, and Turkey, gold serves as an anchor of monetary sovereignty, a way to diversify away from the U.S. dollar and its government bonds without triggering market panic.
Japan and South Korea, although U.S. allies, have also increased holdings modestly as a hedge against currency volatility.
In short: while traders view gold as a price, central banks view it as insurance.
“If it’s not in our vault, it’s not ours”
The most telling shift isn’t just who is buying gold, but where they are keeping it. Historically, central banks stored much of their bullion in the vaults of the Federal Reserve Bank of New York, the Bank of England, or the Bank for International Settlements in Switzerland. These were convenient hubs for settlement and trade. But since the 2010s, and especially after 2022, a steady stream of nations has demanded repatriation – physical delivery of bars back to domestic vaults. Germany moved more than 600 tonnes home from New York and Paris between 2013 and 2017, and the Netherlands, Austria, Hungary, and Poland followed suit. Russia and Turkey have also shifted more of their reserve gold into domestic vaults in recent years, part of a broader trend of central banks diversifying storage away from Western financial hubs. China and India’s central banks, meanwhile, have historically kept their gold domestically.
Repatriation is about more than national pride. It’s a recognition that, in a crisis, custody equals control. Gold held abroad can be delayed, re-hypothecated or frozen by sanctions. Gold at home can be mobilized instantly. As one European central banker put it privately in 2023, “If it’s not in our vault, it’s not really ours.” This shift reduces the “float” of metal available to Western trading hubs, gradually tightening the supply behind London and New York’s paper markets.
Keeping Paper and Physical in Sync
If the paper market sets the price and the physical market sets the foundation, how do they stay connected? The answer is arbitrage. When the price in one region diverges from another, for example, if the Shanghai Gold Exchange trades $20 above London, bullion banks and refiners step in. They buy gold in the cheaper market, ship or swap it to the more expensive one, and pocket the difference. This flow pulls prices back into alignment. The same mechanism operates between COMEX futures and London OTC spot.
If futures become too expensive relative to spot (a “contango”), traders sell futures and buy spot gold. If futures become too cheap (a “backwardation”), they do the reverse. Authorized participants in ETFs also arbitrage price gaps by creating or redeeming shares against physical bullion. These activities normally keep the system coherent. But when liquidity dries up, during financial stress, sanctions, or extreme volatility, arbitrage can break down. That’s when physical premiums in Asia surge even as the “global” spot price falls. It doesn’t mean the laws of supply and demand have vanished; it means the price-discovery mechanism is temporarily dominated by leverage rather than logistics.
Why Prices Can Fall When Demand Is Rising
This paradox baffles many new investors: how can gold drop hundreds of dollars while everyone seems to be buying it? The answer lies in leverage and margin. Most of the daily price discovery happens in the futures market, where traders control large positions with small amounts of collateral. When interest rates rise, bond yields spike, or the dollar strengthens, leveraged funds often face margin calls. They sell what they can, including gold futures, to raise cash. That forced selling drives prices down quickly, even though the underlying physical demand hasn’t changed. It does not mean that gold is now a meme stock.
On October 21, 2025, that dynamic was on full display. Analysts reviewing exchange data later noted that open interest in COMEX gold futures dropped sharply while trading volume exploded, a classic sign of liquidation, not fresh shorting. In plain language: traders were closing positions, not betting against gold.
Once the selling pressure passed, prices stabilized, and premiums in Shanghai and Istanbul barely moved, confirming that physical buyers saw no reason to panic.
This is why short-term gold price swings often tell you more about liquidity conditions in New York than about demand in the real world. It’s also why central banks, with decades-long horizons, simply ignore such volatility.
The Long-Term Structural Shift
Despite the fireworks on trading screens, something quieter but far more consequential is happening underneath: gold is leaving the Western financial system and migrating toward the East.
In 2012, London vaults held roughly 9,000 tonnes of bullion, much of it available for leasing and settlement. A decade later, that figure has steadily declined as metal flows toward Asia. Swiss export data show consistent shipments to China, India, Singapore, and the Gulf. Meanwhile, COMEX’s deliverable inventory, though large on paper, represents a fraction of global demand.
This eastward flow mirrors the shifting balance of economic power. As Asian economies accumulate foreign-exchange reserves, they convert portions into gold. The metal is refined into one-kilogram bars, transported to domestic vaults, and rarely leaves again. Over time, this “hoarding” removes liquidity from Western markets, increasing the leverage ratio between paper claims and physical backing.
In the 20th century, gold moved toward the financial centers of the Atlantic world; in the 21st, it is migrating back toward the manufacturing and trade centers of the Pacific Rim. The monetary significance is profound. If enough nations settle a portion of trade or credit lines using gold-linked mechanisms, even informally, the metal regains part of its historical role as neutral reserve collateral outside the dollar system.
None of this requires a formal “gold standard.” It simply means that gold is once again functioning as a political reserve in a multipolar world.
Making Sense of the Chaos
So how should investors interpret a market where the daily price behaves like gold is now a meme stock, yet long-term demand is stronger than ever?
The key is to recognize that two realities coexist:
- Gold as a financial asset: traded through derivatives, ETFs, and leverage.
This market reacts to interest rates, liquidity, and momentum.
It’s volatile, reflexive, and often divorced from fundamentals. - Gold as a monetary asset: held physically by central banks, sovereign wealth funds, and individuals as a store of value. This market moves slowly, guided by confidence and policy, not by trading signals.
Short-term price collapses, like that of October 21, 2025, belong to the first world. The quiet, relentless accumulation by central banks belongs to the second. Over months and years, the physical market tends to win, because ultimately, paper claims are only as good as the metal behind them.
For individual investors, the lesson is simple: when evaluating gold, decide which market you care about.
If you’re trading short-term movements, understand you’re entering a highly leveraged casino where algorithms dominate and volatility is normal. If you’re investing for monetary insurance, focus on fundamentals, reserve diversification, physical flows, and geopolitical risk, and treat daily price noise as background static.
Conclusion: The Paradox of Modern Gold
Gold today is both a speculative instrument and a geopolitical asset. Its price is discovered in a virtual marketplace dominated by derivatives, yet its value is preserved in steel-doored vaults beneath central banks. It can drop 6 percent in a day because traders unwind positions and rise 50 percent in a year because nations lose faith in paper promises.
The October 2025 volatility is not a sign that gold is now a meme stock, or that it has lost its purpose. It is proof that two parallel systems, one digital and leveraged, one physical and sovereign, are pulling in different directions. The noise of the paper market conceals the signal of the monetary market: a slow, global re-anchoring of trust toward tangible assets.
For investors trying to navigate this new era, the most important insight is not whether gold will go up or down next week. It’s understanding why gold behaves the way it does and recognizing that the world’s central banks are telling you, through their actions, what they truly believe about the future of money.
You may also like